Insurance · Interpretable machine learning
Interpretable Multi-Task Insurance Pricing
Can an insurance pricing model improve predictive accuracy without becoming a black box?
Python · R · PyTorch · Multi-Task Learning · Neural Additive Models · SHAP
Introduction
Motor insurance pricing sits at an uncomfortable intersection. Traditional actuarial models such as generalized linear models are transparent and easy to audit, but their linear structure can struggle with nonlinear risk relationships. More flexible machine-learning models can capture those relationships, but often at the cost of interpretability.
My undergraduate thesis explored whether those two goals have to be in conflict.
I developed a Multi-Task Neural Additive Model (MTL-NAM) that jointly models claim frequency and claim severity while preserving an additive, feature-level structure. The goal was not simply to improve predictive performance, but to build a model whose learned risk effects could still be inspected and explained.
The Pricing Problem
Pure premium is commonly decomposed into two components:
Expected claim cost = Claim Frequency × Claim Severity
Claim frequency describes how often losses occur. Claim severity describes how large those losses are when they occur.
The two tasks are related, but they are not identical. A variable that strongly affects whether a claim occurs may have a different effect on the size of that claim. Modeling them completely independently can miss shared information, while collapsing them into a single opaque predictor can make the result harder to interpret.
The project therefore asks whether the two components can share information during training while retaining task-specific outputs and feature-level explanations.
Why MTL-NAM?
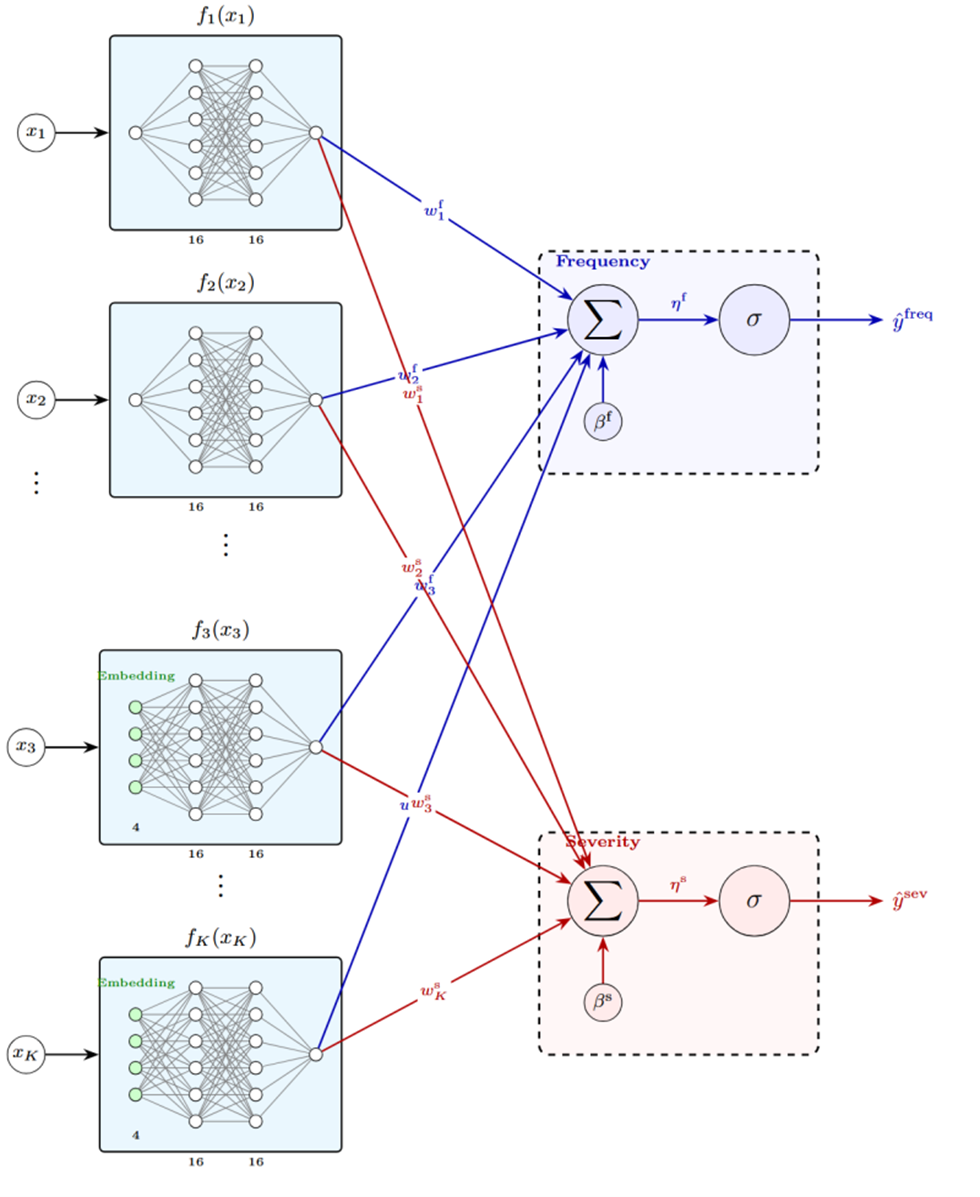
A Neural Additive Model (NAM) keeps the additive logic of a traditional interpretable model, but replaces each linear feature term with a small neural subnetwork. Each subnetwork learns a nonlinear shape function for one feature.
A Multi-Task Learning (MTL) framework trains related prediction tasks jointly so they can share useful representations.
MTL-NAM combines these ideas:
- each feature has its own learnable nonlinear subnetwork;
- feature subnetworks are shared across claim-frequency and claim-severity tasks;
- task-specific weights and output heads allow the same feature to matter differently for each task;
- the additive structure keeps feature effects directly inspectable.
Data and Experimental Design
The study uses the public freMTPL French motor third-party liability dataset, which contains policy characteristics, exposure, claim counts, and claim amounts.
The empirical workflow was:
- prepare policy-level frequency and severity targets;
- apply a common preprocessing framework;
- compare four modeling approaches:
- GLM
- GBM
- single-task NAM
- MTL-NAM
- evaluate out of sample using six-fold cross-validation;
- compare predictive performance using negative log-likelihood (NLL), RMSE, and MAE;
- inspect shape functions and SHAP-based feature importance for interpretability.
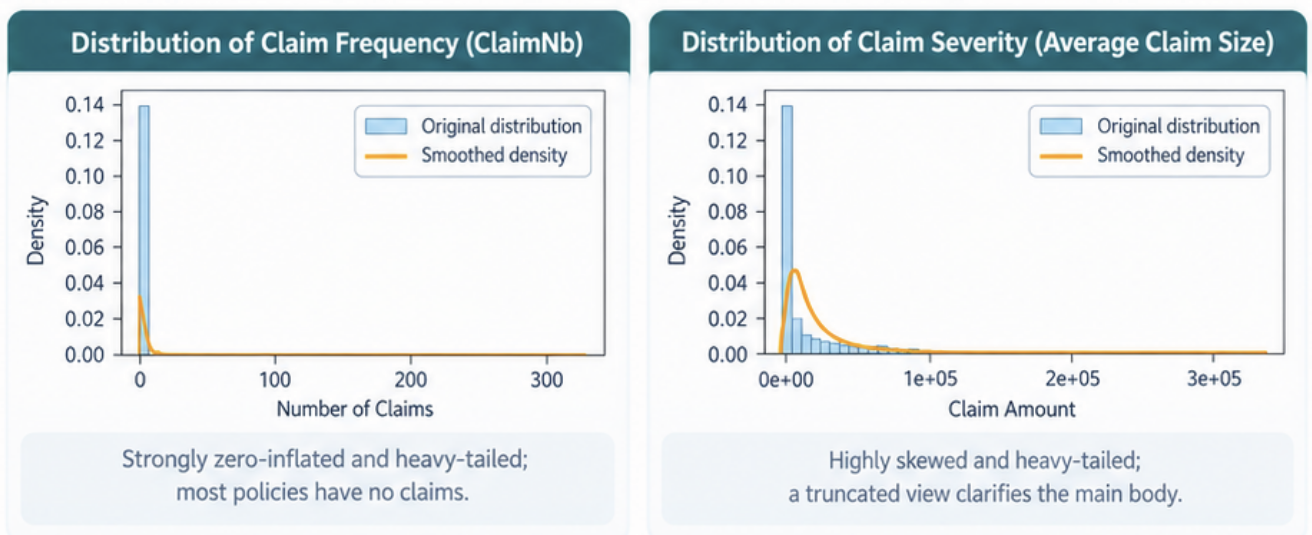
The dataset presents a challenging prediction problem. Claim frequency is strongly concentrated near zero, while claim severity is highly skewed and heavy-tailed. Most predictors also show weak linear correlations with the response variables, suggesting that important structure may be nonlinear.
Predictive Performance
Within the evaluation framework reported in the thesis, MTL-NAM produced the best values across the listed frequency and severity metrics.
Claim Frequency
| Model | NLL | RMSE | MAE |
|---|---|---|---|
| GLM | 0.243 | 2.018 | 0.190 |
| GBM | 0.239 | 2.017 | 0.190 |
| NAM | 0.156 | 2.018 | 0.189 |
| MTL-NAM | 0.155 | 1.998 | 0.187 |
Claim Severity
| Model | NLL | RMSE | MAE |
|---|---|---|---|
| GLM | 1.708 | 21387.021 | 2228.850 |
| GBM | 2.759 | 21369.402 | 1708.529 |
| NAM | 1.620 | 21320.620 | 2219.412 |
| MTL-NAM | 1.605 | 21003.867 | 1634.039 |
The most useful comparison for the research question is not only MTL-NAM versus GLM or GBM, but MTL-NAM versus single-task NAM. Because both preserve an additive interpretable structure, the comparison helps isolate the value of multi-task sharing. In the reported experiments, the multi-task model improves on the single-task NAM across the listed metrics for both tasks.
These results should be interpreted within this experimental framework rather than as evidence that MTL-NAM will dominate every alternative dataset or insurance pricing system.
What Did the Model Learn?
Claim Frequency
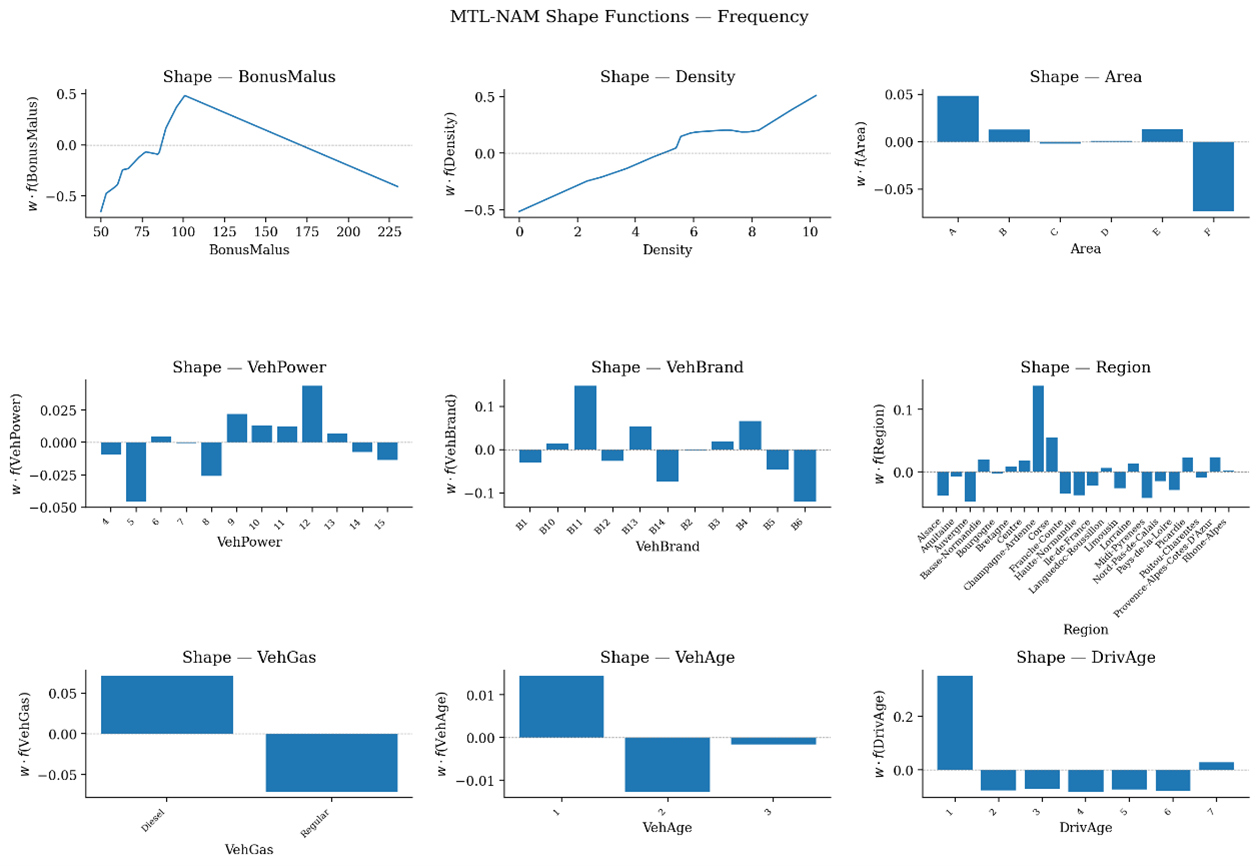
The frequency shape functions reveal pronounced nonlinear and piecewise patterns.
- BonusMalus rises sharply at lower values, reaches a peak, and then declines.
- Density shows a broadly increasing relationship with claim frequency.
- Driver age shows substantially higher risk for the youngest group, lower effects for middle-age groups, and a small increase for the oldest group.
- Vehicle and regional variables show smaller but non-negligible category-level differences.
These patterns illustrate why a purely linear specification may be restrictive: several important relationships are neither linear nor strictly monotonic.
Claim Severity
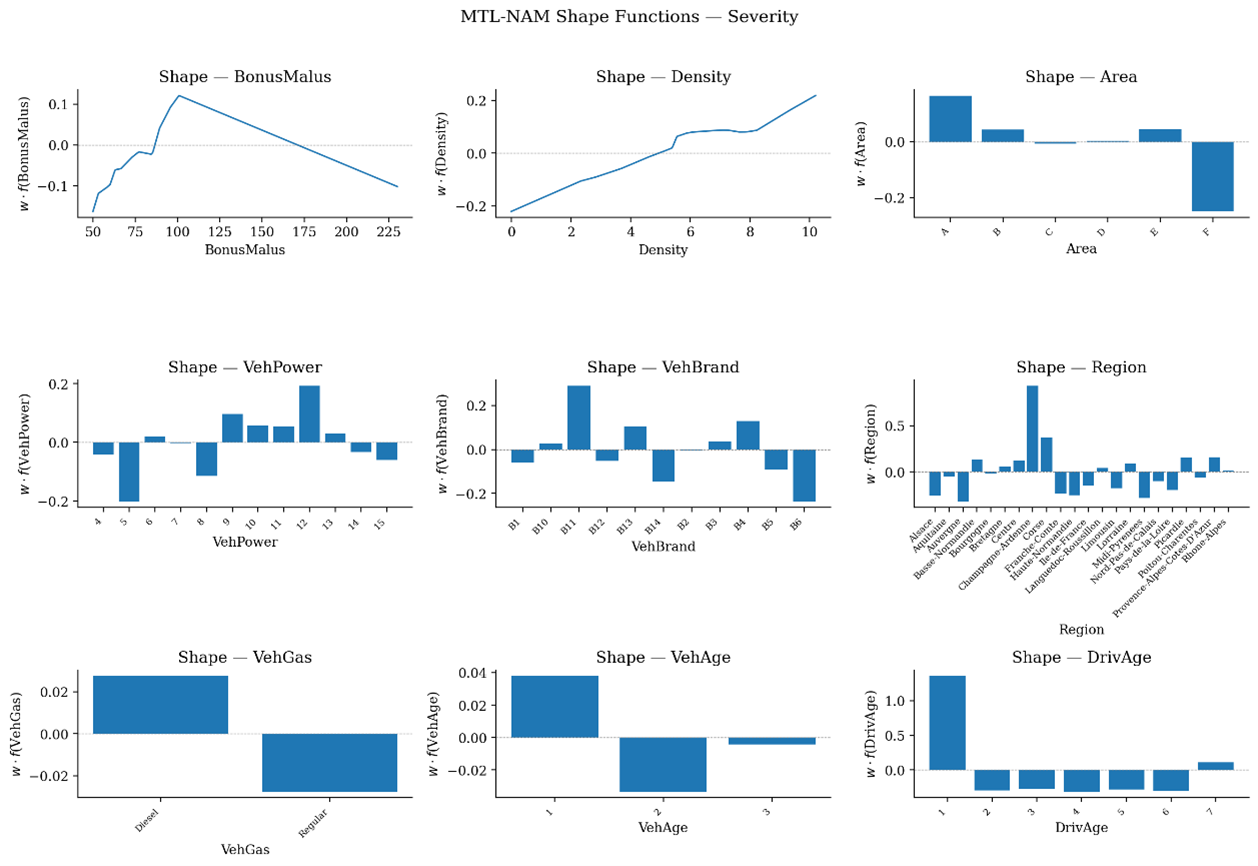
The same variables do not necessarily behave the same way for severity.
- young-driver effects are substantially larger;
- regional differences become more pronounced;
- vehicle power and vehicle brand show stronger piecewise heterogeneity;
- BonusMalus and Density retain nonlinear effects but with different magnitudes.
Frequency and severity therefore share risk information, but the same feature can carry different importance or effect magnitude in each task.
Feature Importance Across the Two Tasks
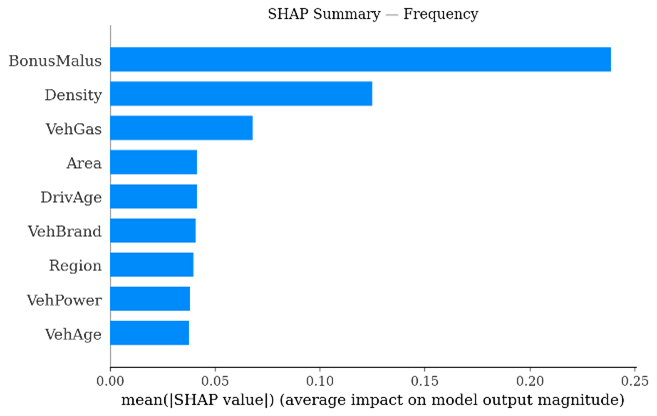
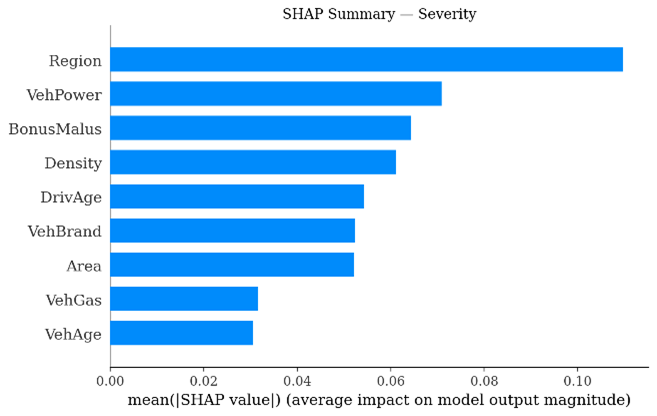
SHAP analysis provides a second view of the model's explanations.
For claim frequency, BonusMalus is the dominant feature, with Density also playing a substantial role.
For claim severity, Region and VehPower become more important, followed by BonusMalus and Density.
The two tasks therefore respond to overlapping but differently weighted risk factors. This is the central intuition behind the multi-task design: share information where the tasks are related, but retain task-specific flexibility where their risk mechanisms differ.
My Contribution
This project brought together actuarial modeling and interpretable machine learning in one research workflow.
My work included:
- formulating pure-premium prediction as related frequency and severity tasks;
- implementing single-task NAM and multi-task MTL-NAM models in PyTorch;
- comparing the proposed model with GLM and GBM baselines;
- constructing a six-fold out-of-sample evaluation workflow;
- generating feature-level shape functions;
- applying SHAP-based interpretability analysis;
- translating model behavior into actuarial risk interpretations;
- documenting the work in an undergraduate thesis and thesis-defense presentation.
Limitations
No explicit higher-order feature interactions
The current additive structure focuses primarily on main effects, so higher-order interaction effects are not modeled directly.
No explicit business-shape constraints
The current model does not impose monotonicity or other actuarial priors, so learned effects can deviate from business expectations.
Single public insurance dataset
The evidence comes from the freMTPL experimental setting and does not establish generalization to other insurance markets, products, or underwriting environments.
Natural extensions include interaction-aware additive models, monotonicity and smoothness constraints, and evaluation on additional insurance portfolios.